In this post, we’ll discuss the top five startup metrics that founders and product managers should measure and analyze.
When developing a new web or mobile app, you generally start off with some preconceived notions about features, as well as user needs and behavior.
But let’s face it, you don’t really know how users will react.
That’s why you begin with a hypothesis and try to either prove or disprove it, in order to minimize the risks associated with launching a new product.
One way to minimize these risks while also gaining a bit of traction is working towards a minimum viable product (MVP). You focus on building out just the core features and then release them out in the wild as your first version.
But once you launch, how do you really know whether the market has taken a liking to your product or not? This is where analytics come in.
Benefits of Analytics
Analytics allow you to collect and analyze large chunks of data from your users, which provide you with insights into what they really think of your app.
The weeks of labor and sweat that go into building your features get validated (or not) through metrics.
It’s a way of grading the performance of your app’s features, along with how well your customer acquisition strategies are faring. By gauging qualitative and quantitative data, you can constantly improve your app experience for users.
In this post, we’ll examine the Top 5 Startup Metrics. We’ll also discuss many of the analytical tools out there that startup founders and product managers might want to use.
Focus on Lean Analytics
Before we dive into the top five metrics, we wanted to emphasize that, as a startup founder or early employee, your time is precious, and statistics don’t always present a complete picture.
Therefore, you need to focus your resources on tracking the metrics that truly reflect the performance and progress of your app.
Determining which of those metrics you should track is quite simple: they need to be comparative. That is, you don’t want to simply monitor absolute numbers, but instead track conversions from one period to another.
According to Alistair Croll and Benjamin Yoskovitz, authors of Lean Analytics, startup founders must avoid falling into the trap of focusing on vanity metrics.
The authors point to one type of vanity metric: total sign-ups. It sounds really good, makes you feel good, and the values do increase over time. But, they don’t tell you how active the users are.
Looking at total active users is a slightly better metric but is still based on absolute numbers as opposed to ratios.
We can therefore deduce that percentage of active users is a great type of metric to track, as it allows for a time-over-time comparison of how your app is doing. This is what Lean Analytics calls actionable metrics.
There is a caveat, however, that comes with comparative metrics, which is the need to establish causality. That is, did some action on your part cause this shift in the ratio? We hope to explore this topic further in a future post.
For now, with actionable metrics in mind, let’s explore our first of the top five startup metrics: cohort analysis.
Metric #1: Cohort Analysis
According to Wikipedia, cohort analysis is a subset of behavioral analytics, which breaks down data into a series of groups (cohorts) based on specific common experiences within a time period.
This metric provides insights into patterns across the lifecycle of a customer.
Cohort analysis is concerned with customer retention and is thereby one of the most important metrics for app developers.
You could track the number of users that install your app. But that only tells half of the story, as they may not be active users. They may have installed your app but then deleted it the next day.
Cohort analysis attacks this problem by visualizing your active users over time, recording daily, weekly, and monthly active users and then correlating that data with installations to see how many users have been retained since installation.
Parse* is an excellent multi-platform service that is generally more renowned for its cloud storage, but also provides an excellent analytical toolset to track customer retention, among other things.

Looking at the above illustration, you can see a percentage value next to the actual values. Those are the actionable proportional metrics that will tell you how you are doing, but don’t address why.
Cohorts are not grouped according to demographics (age, gender, etc.) but based on some common experience, such as those that signed up or purchased something during the same period. (This makes cohort analysis more like a funnel, which we will discuss shortly.)
Within the analytics tab of Parse, you can visualize how many of your users continue to return to your app each day, divided into groups (cohorts) based on sign-up dates.

The columns of the table, then, each represent “day X since the user signed up.” As you travel down the leftmost column, you’re examining the rate at which users returned one day after signup, across cohorts.
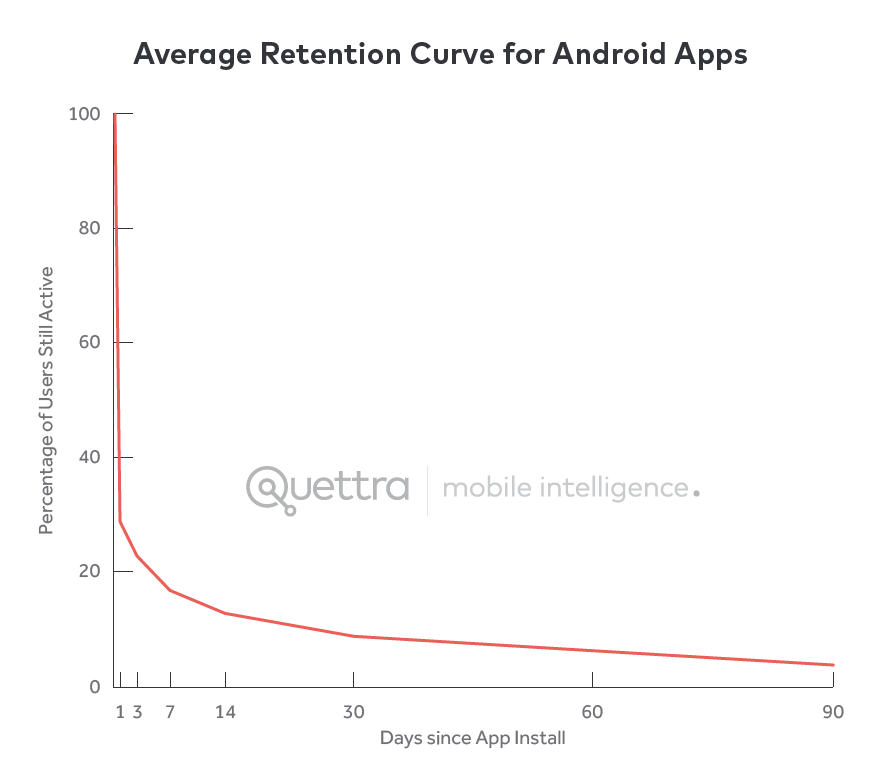
According to Quettra, an average app loses up to 77% of its Daily Active Users (DAUs) within the first three days and over 95% within 90 days. This reflects the fact that users try out your app and compare it to other apps when they install it.
The good news is that those apps that are kept for more than three to seven days tend to “stick around much longer.”
A/B Testing (which we will also discuss later on in this article) is said to be somewhat similar to cohorts in that it is used comparatively.
However, it’s important to note that there’s a distinction between A/B tests that measure and compare two different landing pages or app features and cohort analysis that compares how two or more groups of users behave.
Cohort analysis is crucial for startup founders and product managers to understand retention versus churn, grouped logically rather than treating all users equally. This metric provides a clear picture of customer retention over time.
By remembering that ratios are more important than absolute numbers, you can pay attention to the part of cohorts that tells the true story of your app performance.
Metric #2: Conversion/Funnel Analysis
A conversion or funnel analysis involves tracking a series of events that lead towards a defined goal, such as a user transitioning from engagement to an actual sale within an e-commerce platform.
According to Wikipedia, funnel analyses “are an effective way to calculate conversion rates on specific user behaviors.” This can be in the form of a sale, registration, or other intended action from an audience.
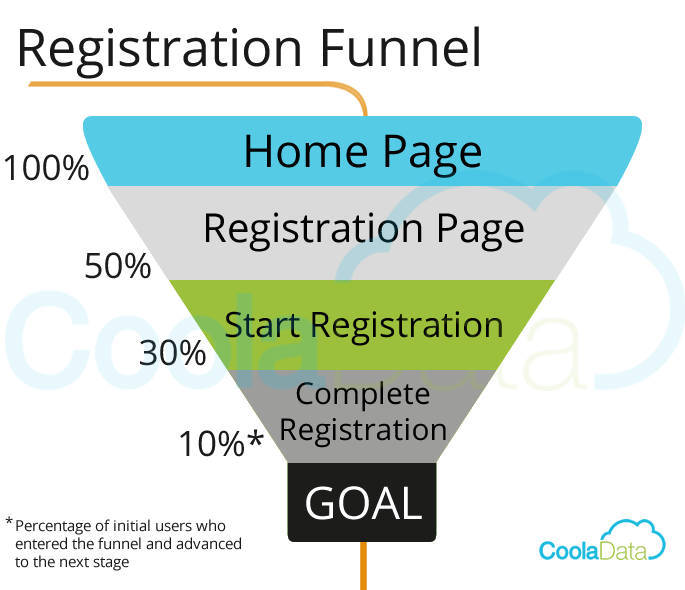
Image credit
To conduct a conversion or funnel analysis, you must first set up your goals, which are made up of the steps a user must take in order to get to a certain screen or complete a particular task (e.g. a purchase).
You can visualize the funnel through a Goal Flow Report in Google Analytics, which provides a wide array of advanced tracking and reporting tools.
With Google Analytics and its SDK, you can either use template goals, such as destination goal or duration goal (time on a particular screen), or create your own custom goal.
Following the actionable metric methodology, you might want to use a funnel analysis to track the ratio of users that have registered their credit card details in the profile section of the app. Are you improving on that month over month?
To some degree, this metric will speak to the UX design of your app, helping to answer whether the design (in addition to the content and/or feature set) inspires users to go beyond the bare minimum actions of your app and convert from a free, passive user to a paying, active user.
This analysis will help you determine whether your existing UX design leads to clarity or confusion for users.
Either way, funnels tell an interesting story and provide great feedback on your UX, among other things.
Metric #3: Demographical Analysis
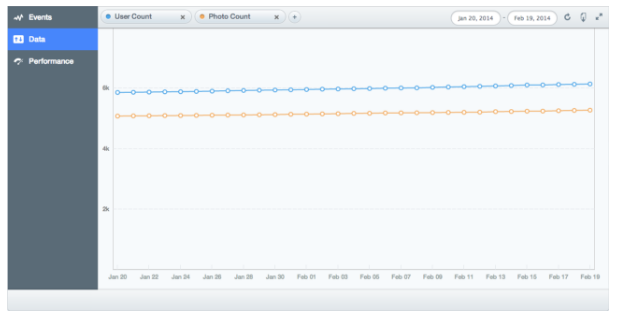
Demographical analysis allows you to track who your app installers are and where they are located.
By tracking app installations, you can segment your users and determine which are of higher value according to factors like age, location, spending amount, device type, operating system version, device language, etc.
All of this data will help you make important decisions regarding issues such as which languages to focus on when localizing your app to appeal to users in certain geographic regions or whether to deprecate support for older operating systems.
You can track the number of installations, as well as demographic information, through Google Analytics, which has a campaign measurement SDK.
On its own, tracking installations isn’t that helpful or important. Instead it becomes useful when you correlate the data with cohorts and can understand how many users are actively retained from incubation (installation) over time.
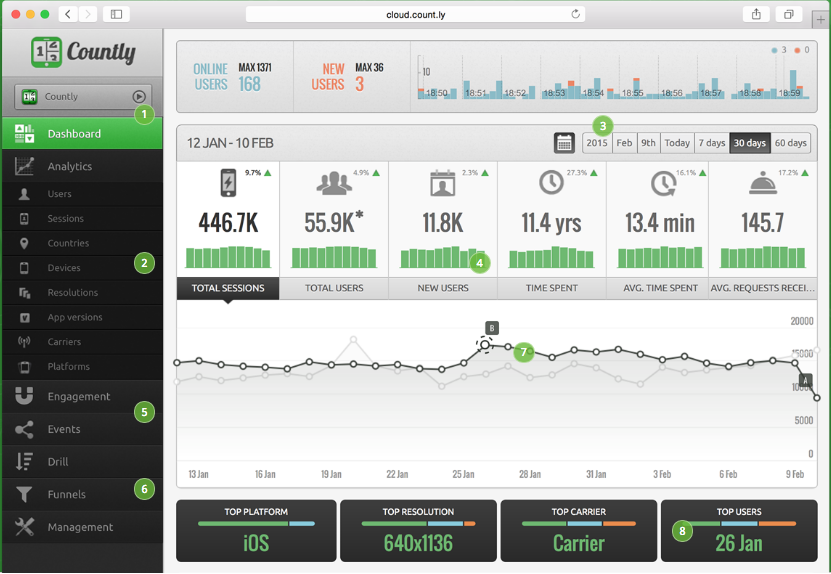
Countly provides a great dashboard that shows installations (new users and total users) in the context of active users retained.
Most analytics tools provide the ability to track user installations. However, until recently, because of App Store restrictions, you weren’t able to easily figure out how users got to your App Store listing from the web.
Seeing where users come from allows you to prioritize your marketing campaigns on the channels that are lacking, as well as boost the channels that already look promising.
Speaking of prioritization, an important aspect of orchestrating your future sprints, from your backlog of tasks, should depend on your user’s demographics. In particular, the device and operating system versions they are using will dictate how quickly you can deprecate support for older SDKs.
For example, if you know that only 1% of your users are using iOS 7, you can deprecate support for it with greater confidence.
There are additional conclusions you can draw from employing device and operating system profiling.
Imagine you’ve deployed a mobile web app as well as an iOS app and notice that a high number of users are using a browser (as opposed to iOS). You may deduce that there are a lot of non-iOS users, possibly Android, and determine there’s a demand for an Android version of your app.
Once again, looking at ratios rather than absolute numbers is key. Are most of your users on a specific operating system version, iPhone version, or screen size, or from a specific geographic region?
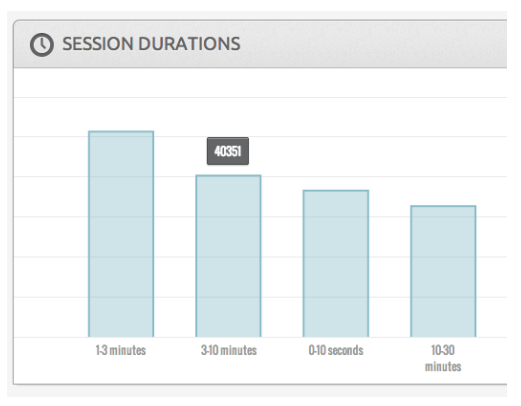
Metric #4: Behavioral/Session Analysis
As the name implies, you use a session analysis to categorize users by sessions.
This approach allows you to track things like how many users have spent a certain number of sessions in your app, which screens were accessed (and how many times a user has seen a specific screen), which buttons were pressed, and which events (tied to specific content, not screen-related) have been shown to the user.

Countly, which we mentioned above, can help you understand sessions and gain insight into whether your app is engaging (where users spend many minutes or even hours) or glance-able (where they spend just a matter of seconds).
Parse*, also referenced above, provides API analytics, which essentially track how many users access a certain endpoint (rather than screen).
This data provides for an interesting segmentation analysis.
Behavioral analysis also covers crash reporting, including the number of app crashes per session and the number of affected users.
Crash reporting is an analytics measurement that is mostly concerned with the development and testing teams, providing insights into how often crashes occur, from what devices/environments, and what are the most frequently occurring crashes.
Twitter’s Answers analytics tool, which is part of the Fabric suite, provides great insights into tracking crashes and test build distributions.

Knowing where bugs are occurring analytically is especially helpful during the earliest stages of a startup, as the development team and project manager(s) prioritize issues during each sprint.
Many of the SDKs, including Parse, also provide the ability to generate your own custom tracking. For instance, you could decide to track sign ups and provide additional properties, such as gender and source origin.
Using the SDK, you would get something back like this:

You are also able to track your user’s behavior in real-time, using real-time analytics, which is all about the moment. These metrics will show you what’s happening in your app’s current session, reported seconds after it occurred, and indicate whether any goal conversions are happening.
Real-time analytics are particularly useful during marketing campaigns, as you can monitor how your traffic is affected and determine whether a certain promotion is having the desired impact.
Due to its high level of customization, this is a more advanced analytic to implement. As a result, most startups don’t employ this approach until later, unless there is a compelling reason to report a specific segment early on in the MVP.
Twitter’s Answers has announced it is providing custom event tracking, in addition to an array of other types of analytic measurements alongside Parse and Google Analytics.
Another behavioral analytic is measuring user engagement across devices. This metric is important because most users will end up using your app on more than one platform, which means you must determine your Customer Lifetime Value (LTV) by measuring across multiple sessions.
Determining LTV gives you an understanding of how valuable different users are from the day they install your app on an iPhone, use your app on an iPad, and your web version later on.
Google Analytics is a great tool for measuring LTV across platforms by using Google+ as a common authentication mechanism.
Parse takes a similar approach using Facebook authentication, while Answers and the other Fabric tools do so via Twitter authentication.
Metric #5: Push Campaign Tracking and A/B Testing
Push campaigns refer to the tracking of push notifications, including how many users receive the notifications and how many take some type of action in response.
iOS 8 introduced even richer push notification engagements, through the ability to provide action buttons (such as read or check in), which also extend to the Apple Watch.
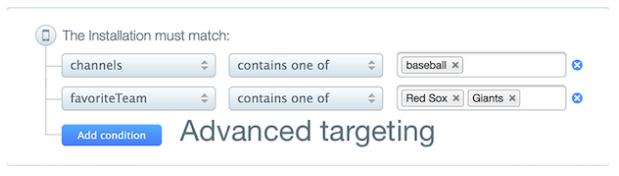
In addition to providing the capabilities to send them out, Parse allows for advanced targeting and segmenting of push notifications based on various demographic information.
The most common triggers of push notifications are direct messaging based on new content or user-to-user engagement. But, orchestrating a push notification strategy triggered by marketing campaigns provides another powerful use case.
We saved this metric for last, as it’s dependent on the various other metrics we mentioned previously. You can target your push notifications to specific users, whether they are high lifetime value users or are users who downloaded your app but haven’t been back since.
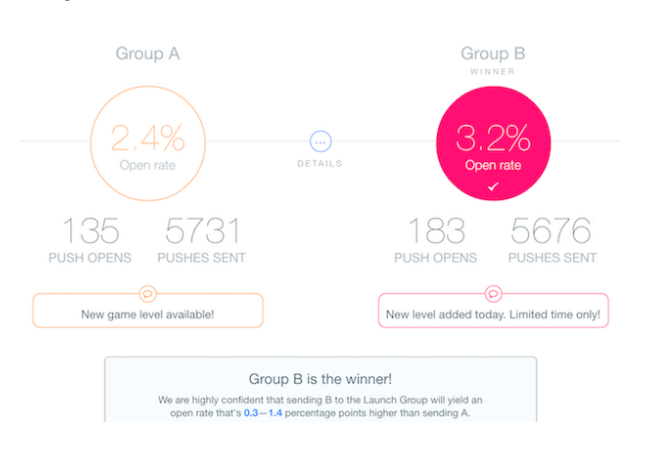
Another tactic would be to employ an A/B testing campaign, where you would send one group of users one message set, and a second group a different set. This can be done conveniently via the Parse interface.
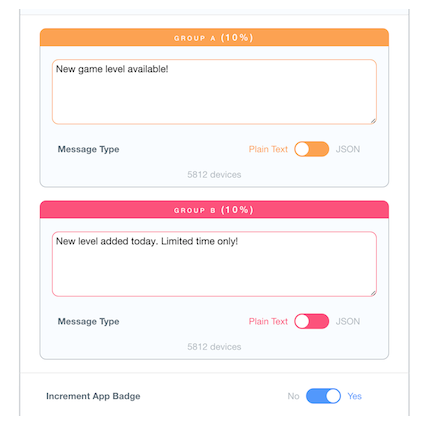
Based on push actions, you would then be able to determine which group responds more positively to one campaign versus another.
Conclusion
In this post, we established why analytics and metrics are crucial for startups, as they can help you prove (or disprove) various hypotheses and validate your performance as a founder or product manager.
They can even play a role with investors during the fundraising process!
As promised, we presented the top five startup metrics, all of which should be easy to measure, understand, and take action upon:
- Cohort Analysis
- Conversion/Funnel Analysis
- Demographical Analysis
- Behavioral/Session Analysis
- Push Campaign Tracking and A/B Testing
You don’t necessarily have to implement all five of these startup metrics. But knowing which ones are most helpful at various stages and for various purposes can help you calibrate your product offering based on useful feedback.
Above all, it’s important that vanity metrics aren’t used as a true projection of your team’s progress, but rather metrics that are comparable.
There is an abundance of iOS and Android SDKs out there that you can use to measure these top five startup metrics. Which tool(s) you use will be based on your app’s functionality and design, as well as your preferences regarding the tools’ dashboards and functionality.
*Note: Since this post was first drafted last year, it was announced that Parse (which was previously acquired by Facebook) will be shutting down in January 2017. Firebase, which has been acquired by Google, offers some of the same tools as Parse, so we recommend checking into it as an alternative.
