This is the third post in our technical debt series. We have explained what technical debt is and explored different ways of calculating it. Now we’ll examine tools that can assist with technical debt computation.
Introduction
In the previous posts, we discussed the definition of technical debt, its importance in any software system, and its affects on the lifecycle of a product.
We also dived into some of the more technical aspects, explaining how technical debt can be expressed in man-days or currency. Finally, we briefly discovered how to calculate some important factors like test coverage and code complexity.
It’s obvious that computing technical debt cannot rely on a manual or ad-hoc process. Even if we assume that the computation of all factors affecting it can be done manually, it would take too long to get the technical debt measurement.
In a practical sense, this means that, by the time you have the numbers ready, they are already out of date because the codebase is a living object that changes continuously.
Fortunately there are some tools that can handle all of these computations automatically and give you nice dashboards that clearly display the technical debt of your software.
In this post, we will present three of these technical debt computation tools and explain the most useful features offered by each.
Evaluation Criteria
There are many tools that offer code quality analysis to some extent.
Some of them are focused only on particular programming languages. Others are primarily code review tools that provide automatic reviews for pull requests (via integration with popular source control management systems). There’s also a third category that covers only a few of the technical debt factors.
This series is about technical debt, so we filtered out any tools that do not report directly on technical debt (even if they calculate some of the metrics involved).
We also wanted to make this post language-agnostic and thus excluded tools that do not cover the most popular programming languages (Java, JavaScript, C++, C#, PHP, etc.).
The last criteria were ease of use and the existence of a web-interface and comprehensive dashboard that can be used by both technical and non-technical people.
We were surprised that only a few tools successfully passed our “tests.” We’d been hoping (deep inside) that the software industry was investing more on minimizing technical debt by creating tools to calculate it and help development teams improve their code quality.
Still, the three tools that we present in the next sections provide all that is needed to effectively manage and reduce your technical debt.
![]()
SonarQube
SonarQube (previously known as Sonar) is a free, open source code quality management ecosystem that allows developer teams to manage, track, and eventually improve the quality of their codebases.
It’s a web-based application that maintains historical data and identifies trends of leading and lagging indicators of a variety of quality metrics (including technical debt).
SonarQube can be downloaded, installed, and run locally in less than 10 minutes. There’s no need to set up a database to evaluate its features nor are any other external dependencies needed, which provides an excellent first impression.
Analyzing code is extremely easy as the tool provides a plethora of ways to do it.
If you are a Java house, simply download the plugin of your favorite build tool (e.g. Ant, Maven, Gradle). For .NET projects, the recommended process is to download and use the MSBuild analyzer.
For projects using other programming languages (more than 20 are supported via plugins), the generic runner should be used to trigger a SonarQube analysis.
If you want to quickly see some screens, pages, and graphs or if you don’t have the technical skills to analyze a codebase, you’re in luck. SonarQube has a public instance available, which contains quality data for all of the supported programming languages and the most popular open source projects.
Dashboards
In SonarQube, you can view global and project dashboards.
Global dashboards are used to report information for all or a subset of the projects analyzed in the same SonarQube instance and can be presented in various ways (tree views, pie charts, histograms, or just plain lists). As the name implies, the project dashboard reports the metrics results of one particular project.
What’s really cool is that you can fully customize both dashboards by adding or removing widgets of information.
This means that a developer can add several widgets displaying deep technical metrics, like complexity, rules violations, or duplications. Non-technical managers, on the other hand, who don’t need this level of granularity can create a simple dashboard with a few widgets that make sense to them.
And what are these widgets? You’ve probably already guessed: technical debt widgets.
Technical Debt Reports
SonarQube ships with three technical debt widgets that display important, aggregated information in a nice and comprehensive way.
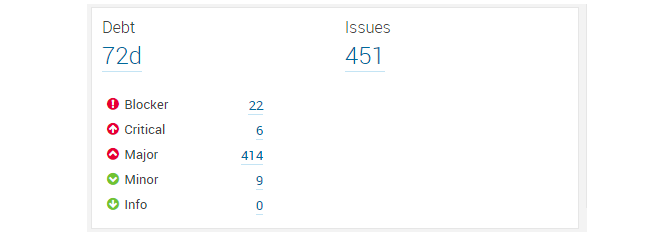
The first (as shown in the image below) reports the number of man-days needed to fix all problems in the code base. It also provides data about the number of issues per level of severity (from “minor” to “blocker”).
Clicking on any number navigates to a page where you can see more details about the issues reported per module, package, etc. This view is called a drill-down, and it’s one of the most popular pages in SonarQube.
Knowing the number of man-days you need to invest to eliminate all technical debt is helpful. But, as we discussed in the previous post, it’s not enough. Without having more context (i.e. the size of the project), it’s impossible to tell if this number is good or bad.
The second widget (see image below) comes to the rescue by displaying two numbers. The one to the right is the technical debt ratio, which represents the time needed to fix all quality issues relative to the time that has already gone into the application development.
As we explained in the last post, this ratio fixes the problems associated with expressing technical debt as man-days only.

In this example, the technical debt ratio is 49.8%. This means that the development team needs to spend nearly 50% more time than they have already spent to eliminate all technical debt. This is clearly not a good result for this particular project.
But what’s that SQALE rating appearing to the left?
SonarQube internally uses the SQALE methodology to compute the technical debt ratio and to classify the project to a SQALE rating.
Based on the outstanding remediation cost, the project is rated from A to E according to the following rules:
- Technical Debt (TD) Ratio <=10%, the rating is A
- 11%<= TD Ratio <=20%, the rating is B
- 21%<= TD Ratio <=50%, the rating is C
- 51%<= TD Ratio <=100%, the rating is D
- over 100%, the rating is E
The last widget (illustrated below) is called the “Technical Debt Pyramid.” It’s a simple representation of the technical debt added to the system per characteristic. SonarQube internally attributes all reported issues to one of the categories shown in the image.
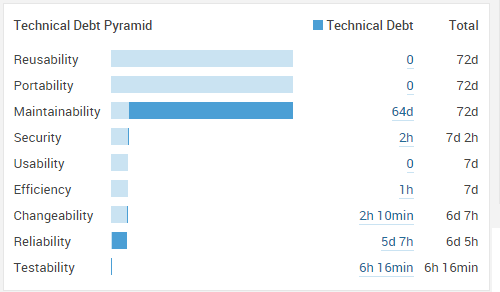
The bars in the graph show the time needed to fix all quality issues per characteristic.
The dark blue refers to the time needed to clean up the code as a result of the issues reported on this characteristic. The light blue shows the cumulative time required, reading the graph from bottom to top.
In a glance, the development team can easily understand where the biggest problems on this project are: maintainability and reliability!
Again, every number is clickable, so you can drill down to the next logical level to see details about each characteristic and better understand where more effort is needed.

SQUORE
SQUORE by Squoring is a commercial product that can be used in a variety of ways to manage software quality, including technical debt management, acceptance criteria management, project management based on automotive principles and processes, etc.
In this article, we will describe the features offered by the technical debt management version. It’s a web-based application and, like SonarQube, utilizes the SQALE methodology to compute technical debt metrics.
Evaluating SQUORE is pretty easy. All you have to do is either navigate to the public demo instance or request a trial. For the trial, you have to zip your project and submit it via the website. After a couple of days, your dashboard will be ready.
Commercial users can download and install the latest version of SQUORE on their own devices. The installation and configuration process is straightforward as everything that’s needed (application server and database server) is bound to a nice installer, which supports both Linux-based and Windows operating systems.
For this article, we’ve used only the demo instance that was prepared for us. But if you want to read more about the installation and configuration steps, check out the latest documentation.
Technical Debt Reports
The SQUORE dashboard is split in two sections.
Technical Debt Indicators
On the left side, you can browse projects and artifacts and see which technical debt indicator is most affecting code quality.
SQUORE uses four indicators — efficiency, portability, maintainability, and reliability — to calculate the technical debt. The following image provides a sample of what information you can see about your project.

The tree nodes are clickable, providing more details about sub-categories or specific rules affecting the technical debt.
Take a look, for instance, at the following image that illustrates some of the quality checks applied to the source code regarding maintainability.

In short, quality rules are assigned to a basic indicator and to subsequent indicators. Every time a violation is found in the code, it’s added to the corresponding indicator density. The summary of them is called the technical debt density.
You might have already recognized a ranking system, reminiscent of what we saw in the SonarQube dashboards. Indeed, SQUORE provides a similar rating (with grades from A to F) according to the following technical debt density scale:
- TD Scale = 0, the rating is A
- 0<= TD Scale <=300, the rating is B
- 300<= TD Scale <=1000, the rating is C
- 1000<= TD Scale <=1500, the rating is D
- 1500<= TD Scale <=2000, the rating is E
- 2000<= TD Scale <=5000, the rating is F
Based on the above scale, to get an “A” for your project, you must eliminate all technical debt.
But practically no project would be able to get an “A” because (as we discussed in the previous post) all software projects have and should have some technical debt. It’s inevitable! So the best score you can get in SQUORE is really a “B.”
Widgets
The right side of the dashboard is composed of various tabs, and every tab presents information using widgets. We will describe only the widgets that are related to technical debt representations.
The most interesting widget is the “remediation cost.” As shown in the image below, you can see how many man-days are required to eliminate all technical debt. The same information is presented in currency (USD in this case) per indicator and for the total technical debt.

The same information can also be displayed as a breakdown chart or a distribution chart, as illustrated in the following two images.
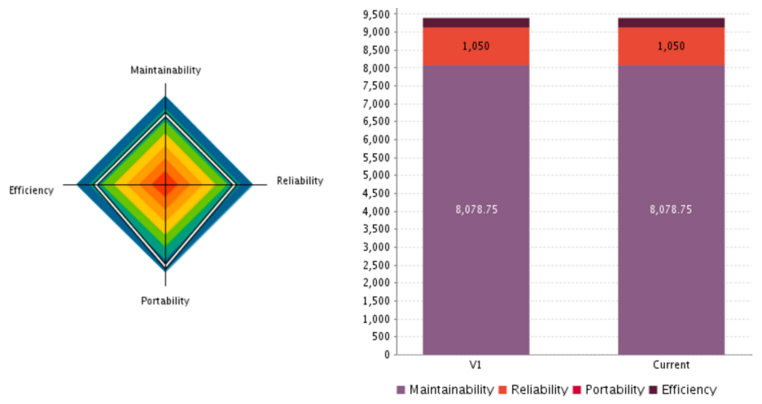
Examining both widgets will lead to the same conclusions. In this particular project, for instance, maintainability is the most problematic indicator followed by reliability, whereas portability and efficiency seem to be in good shape.
There are some additional SQUORE widgets that display the distribution of technical debt across classes or across functions. This is extremely useful in cases where development teams want to focus first on the worst areas due to lack of time or experience.
What’s really cool in SQUORE — although we didn’t have a chance to confirm it independently — is the fact that the four indicators we described above take into account not only the code base (source + unit tests), but also documentation quality, available functional requirements, etc.
This approach makes the technical debt computation more accurate and complete.

Kiuwan
Kiuwan is a commercial solution for code quality management, which is offered as a software as a service (SaaS) product.
You can choose your plan according to your (development team) needs and enjoy a full set of code quality services, including static analysis based on custom analyzers, duplicate code detection, more than 60 quality metrics, technical debt computation, what-if analysis, historic data and comparison to previous versions of the codebase, action plans, and more.
All of the above are visualized through user-friendly and fully-customized dashboards, which makes Kiuwan a very attractive choice.
Since Kiuwan is a cloud-based solution, you can apply online for a two-week evaluation period and test all the available features with no limitations.
All major programming languages (Java, C/C++, JavaScript, PHP, C#, .NET, VB, Objective-C, Cobol, SQL, etc.) are supported. Kiuwan also provides support for popular frameworks like Android and Hibernate with specialized rule sets.
Analyzing a code base with Kiuwan can be done in two ways. You can either zip your code and upload it to the web analyzer, or you can use the local analyzer, a command line, and GUI utility.
The latter option will allow you to analyze your code locally without uploading it to Kiuwan’s platform. However, you also have the option to upload the related source code fragments to the identified rule violations, which will make the web dashboard reports more comprehensive and valuable.
Once the analysis is completed, the results will be uploaded to your Kiuwan account and displayed on your project dashboard.
Technical Debt Reports
Kiuwan’s dashboard is great! It’s simple, colorful without confusing the user, and contains all of the important information on one page.
On the left side, you can find a list of your analyzed projects. On the right, there are several tabs that display quality analysis information. As with the two previous tools, we will focus only on the technical debt-related widgets.
The summary tab is where you can find a high-level picture of the project (as illustrated in the image below). There are three main widgets related to technical debt, although the term “technical debt” is not actually used anywhere.
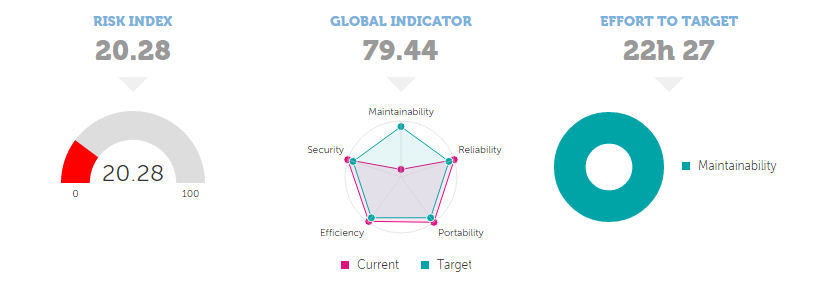
Starting in the middle, the “global indicator” has the same meaning as technical debt ratio in SonarQube or technical debt density in SQUORE.
Kiuwan uses an internally-developed quality methodology known as CQM that stands for “Checking Quality Model” for Software. CQM suggests five indicators: maintainability, reliability, portability, efficiency, and security, which correlate with the software characteristics.
The higher the global indicator, the better the quality of the analyzed project. By default, Kiuwan assumes that if you get a global indicator of 90, your project is at the highest level of quality you can achieve. This threshold can be configured to match your needs or any special project requirements.
The widget on the right labeled “effort to target” shows the number of man-days needed to fix all defects found to reach your global indicator quality threshold (which, as we mentioned, is set at 90 by default).
Every rule has an estimated effort to fix and is assigned to one of the five indicators above. Again by default, Kiuwan computes the minimum set of rules that need to be fixed to get the global indicator up to 90.
Finally the widget on the left side is quite interesting. It’s actually a combination of the other two widgets and tells you about the risk of the project.
Simply put, if the global indicator is low and the effort to target is also low, then the risk is low because it assumes that the development team will be able to fix the problems easily. If, however, the global indicator is low while the effort needed is high, then the project might be at risk because it’s difficult to bring the code base back to a good level of quality.
Kiuwan has two additional tabs (metrics and defects) that give you low-level information.
In the first tab, you can find a plethora of metrics about complexity, coupling, documentation, duplicated code, effort to the target, governance, indicators, etc. The second tab is actually a search page where you can look up rules by indicator, programming language, or priority.
In Summary
To conclude, here are the top three advantages of each product we’ve discussed, which will help you determine which technical debt computation tool is right for you.
SonarQube
- Free: You can use the full version without limitations. Of course, there are commercial plugins. But you only have to pay for them if you need analysis for specific languages or need to get extra features.
- Polyglot: There are hundreds of rule checks for almost all of the most popular programming languages.
- Clear technical debt metrics: The technical debt ratio and the underlying SQALE methodology ensure that you get the most accurate and correct technical debt computation.
SQUORE
- Clear technical debt metrics: As with SonarQube, the technical debt density and underlying SQALE methodology ensure that you get the most accurate and correct technical debt computation.
- Full picture: Several widgets/graphs illustrate the technical debt from different perspectives and angles.
- Goes beyond code base: The technical debt computation takes into account not only the code base but also documentation quality, available functional requirements, and other non-coding related factors.
Kiuwan
- Clean design: Powerful and clean dashboards show you exactly the information you need.
- Polyglot: As with SonarQube, there are hundreds of rule checks for almost all of the most popular programming languages.
- Risk analysis: With just a glance, you can easily understand if your project is at risk or not.
